ENGAGED
Project Elevator Pitch
Confidential · For registered investors
Issued
2026-07-21
CTC
Ontario · Commercial RE
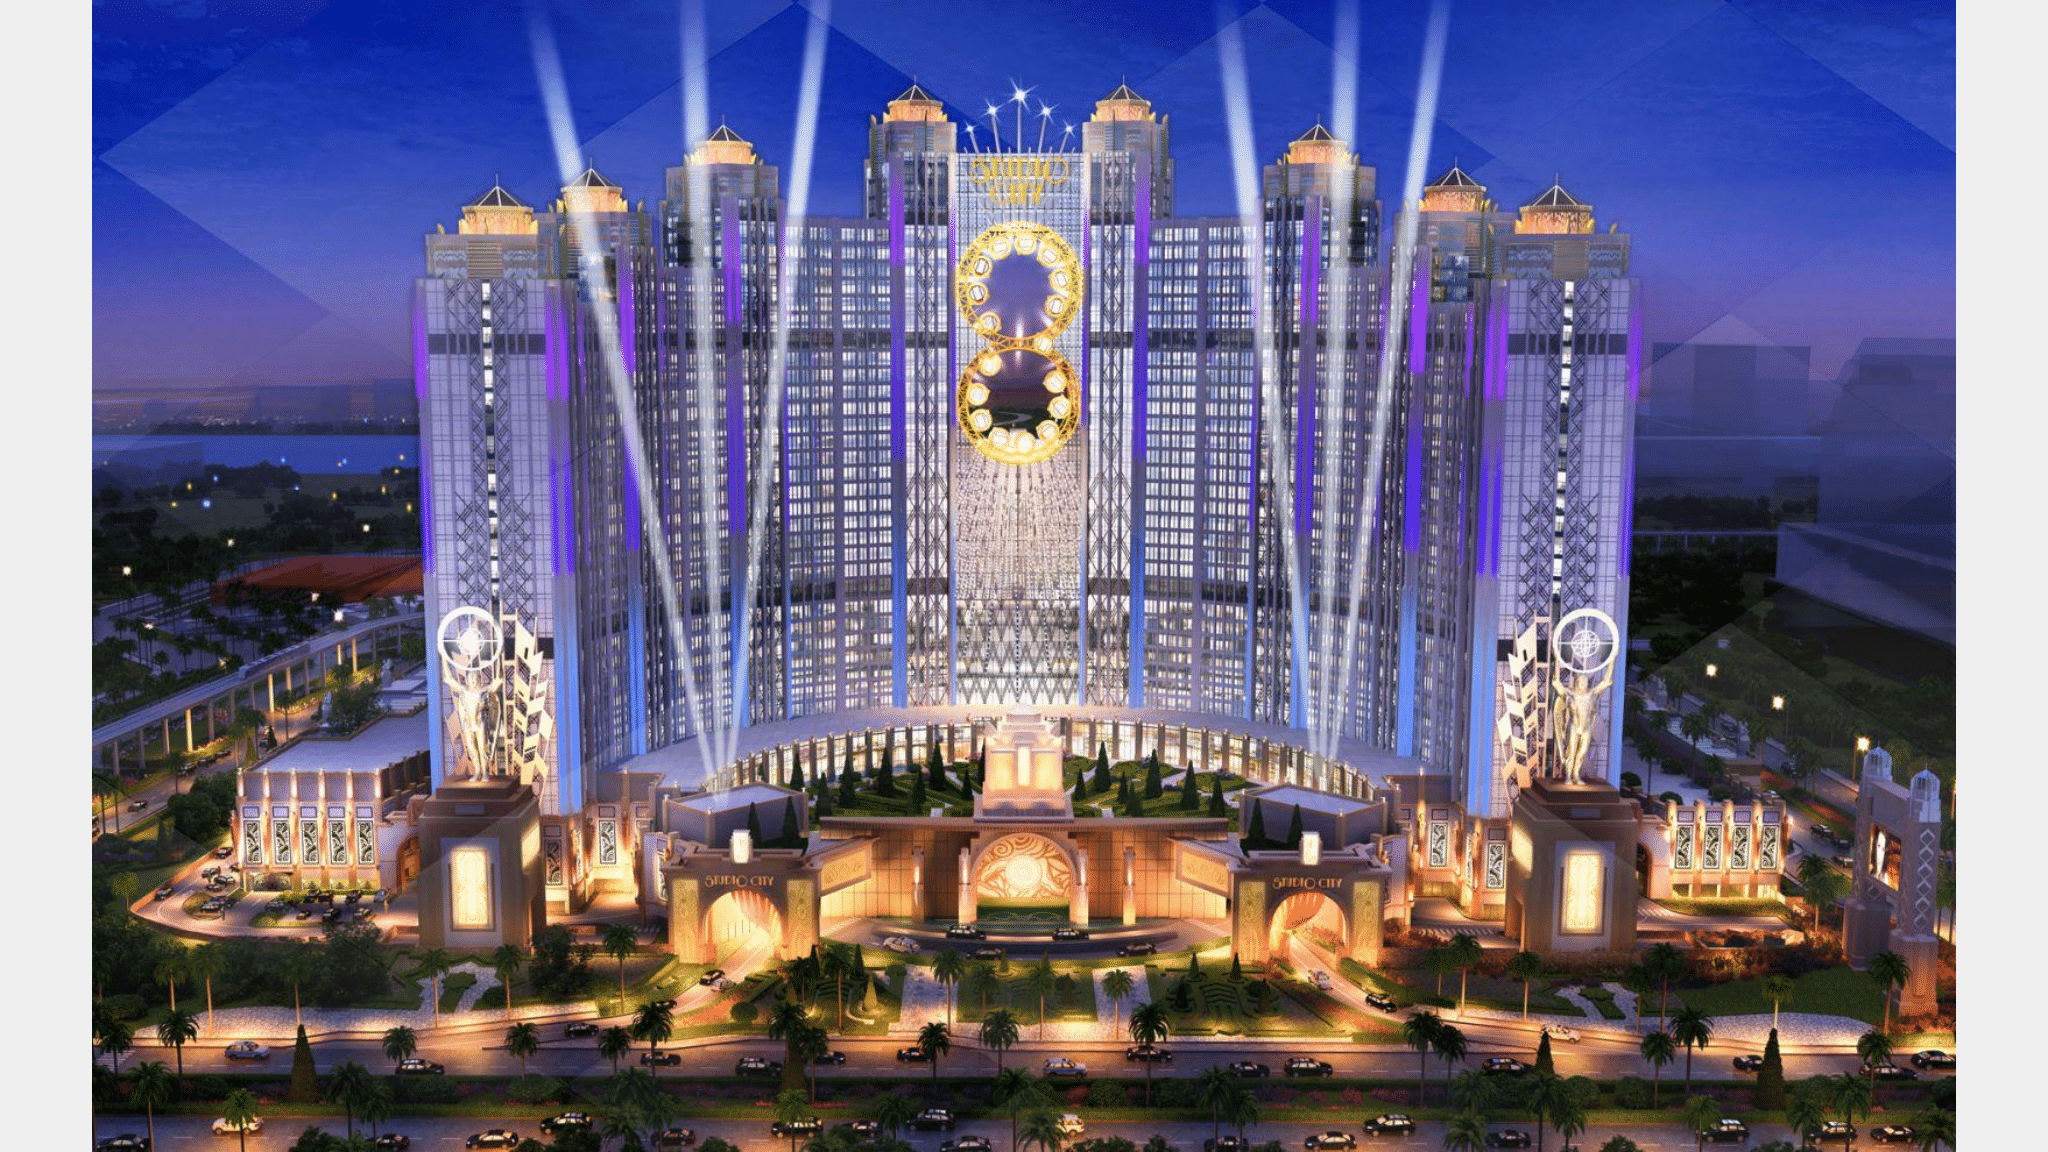
Hotel and Casino | London, Ontario
Commercial RE
Hospitality
Hotels/Resorts
Leisure/Recreation
Capital Sought
USD 1,250,000,000
Spent to date
USD 10,000,000
Country
Ontario
Repayment
Independent and credible feasibility study
Submission Ready Indicators
LTV Expectation
90%
Land / Site
Sale/lease agreed
EPC Contracts
Signed
Off-take Agreements
Signed
Projections
Completed and available
This opportunity qualifies for Internationally A+-rated Insurance Wrap — elevating the debt element of project financing through the Lloyds-of-London insurance market.
About this opportunity
The MMJ Family Resort and Gaming project will be located in the greater Toronto - London, Ontario metroplex, a region supporting a very large and wealthy population draw. This $1.3 Billion Casino and Resort, operating under the sovereignty of the Chippewa Indian Nation, is shovel ready and partnered with MMJ, who will build and manage the operation.
MMJ has a 43 year long track record and successful history of construction and management of partnering with Sovereign Indigenous nations, having developed 27 Native American casinos throughout the USA and Canada, The Indian Nation Elected Council has made the final decision and approved the Family Destination Resort to move forward. Draft calculations suggest a gaming revenue capture figure during the first full year of full operation of $493Million(CAD) and patrons of 4.3 million.
The objective is to create an all-weather destination that provides a mix of attractions that overwhelm present and future regional competition.
The London-Toronto area is described as being at the tip of the 12th largest mega region with a 22 million population and an economy of ½ Trillion dollars. It spans from London Ontario to Quebec City and down to Buffalo NY.
Five-year projections
All figures in USD| USD | Year 1 | Year 2 | Year 3 | Year 4 | Year 5 |
|---|---|---|---|---|---|
| Turnover | 332,152,000 | 365,367,000 | 383,636,000 | 395,145,000 | 406,773,000 |
| EBITDA | 116,882,000 | 139,476,000 | 149,659,000 | 154,148,000 | 158,773,000 |
| Margin % | 35 | 38 | 39 | 39 | 39 |
PFX registered investors were provided with the dataroom for this project prior to listing.
Register as Investor
PFX registered investors have preferential access to quality PFX listed project finance opportunities. Sign in.
Confidential — PFX Registered Investors Only · Not for redistribution
PFX / CTC / 2026-07-21